
An energy diagram is often used to describe chemical reactions. These diagrams help trace the reaction’s progression from starting compounds to final products from left to right. Energy diagrams describe the physical or chemical processes of the reaction.
Energy Diagram– Definition
A diagram that compares the internal energy of the reactants and products is called an Energy diagram.
The amount of relative potential energy in each stage of a reaction is illustrated in energy diagrams. Reactants, transition states, and products are commonly modeled on energy diagrams. (Although depending on the reaction can include more information such as intermediates, activation energy, etc.)
The terms “energy diagrams” and “reaction coordinate diagrams” are interchangeable!
Free-energy diagrams, also known as reaction coordinate diagrams, are graphs that portray the energy changes during a chemical reaction. The horizontal axis reaction coordinate represents how far the reaction has progressed structurally. Positions along the x-axis near the reactants have structures similar to the reactants. Also, the positions near the products have structures similar to the products. While other points along the graph represent unstable structures and we cannot isolate them. Peaks on the energy diagram represent stable structures with measurably long lifetimes.
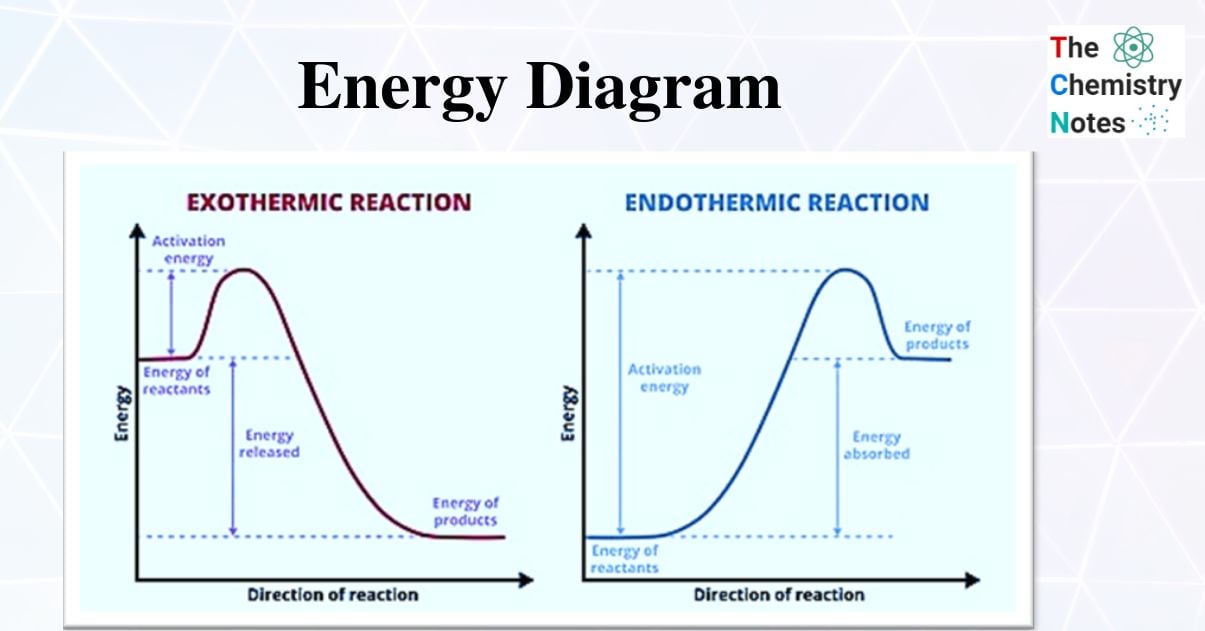
Exothermic and Endothermic Reaction Energy Diagrams
Using these diagrams to indicate whether a reaction is exothermic or endothermic is one of their most popular applications.
- Energy diagrams for exothermic and endothermic reactions differ slightly, and it is critical to understand the difference between the diagrams as well as to interpret correctly.
- Endothermic reactions gain energy/heat, so the reactants should be lower on the graph than the products (pictorially implying that the reaction is gaining energy!) whereas exothermic reactions consume/lose energy/heat during the reaction, so when drawing the graph, the reactants should be higher on the graph than the products (thus showing that the reaction is losing energy)
- The activation energy on endothermic energy diagrams is higher than that on exothermic energy diagrams because endothermic reactions have a higher activation energy than exothermic reactions.
- Exothermic reactions have a lower activation energy than endothermic reactions, so the activation energy on the exothermic energy diagram is lower than on the endothermic energy diagram.
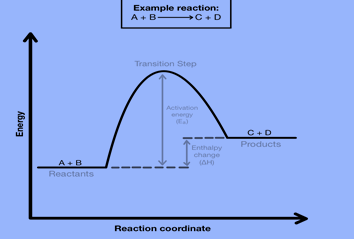
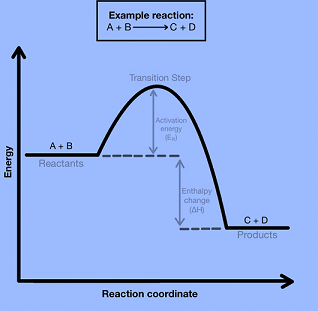
The transition state or activated complex is a high-energy unstable structure. Bonds breaking and/or forming occur at the same time in this high-energy process. The structure becomes new, less strained structures as a result of its extreme strain.
Potential Energy Diagrams
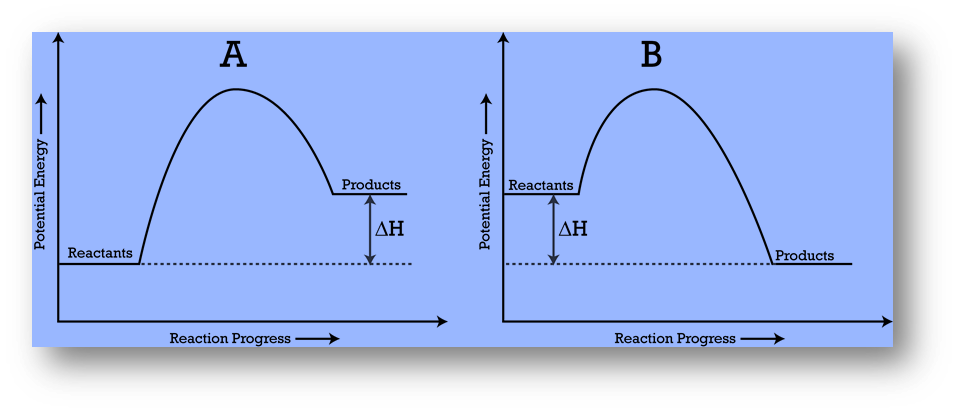
A potential energy diagram, also known as a reaction progress curve, represents the energy changes that occur during a chemical reaction.
- A potential energy diagram illustrates how a system’s potential energy changes as reactants convert into products.
- The diagrams also represent basic potential energy diagrams for endothermic (A) and exothermic (B) reactions.
- The enthalpy change for an endothermic reaction is positive and negative for an exothermic reaction.
- As the system absorbs energy from its surroundings, the total potential energy of the system increases for the endothermic reaction.
- As the system releases energy, the total potential energy of the system decreases for the exothermic reaction.
Hammond Postulate
George Hammond developed a theory that connects the characteristics of a transition state to where it is on the reaction diagram.
According to the Hammond Postulate, a transition state will be energetically and structurally similar to the species that is closest to it on the reaction diagram.
The transition state in an exothermic reaction resembles the reactant species, whereas the transition state in an endothermic reaction resembles the products.
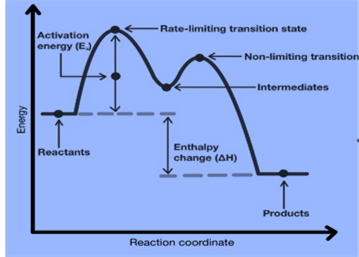
Energy Diagrams of Multi-step Reaction
Each step in a multi-step reaction has an associated activation energy and transition state. Such reactions’ transition states are punctuated by reactive intermediates, which are represented as local minima on energy diagrams.
Reactive intermediates are the result of bond breaking and also we cannot isolate them for long periods.
Read the Differences Between Endothermic and Exothermic Reactions
Reference
- R. Chang, “Physical Chemistry for the Chemical and Biological Sciences”, University Science Books, Sausalito, California (2000).
- Aston, J. and Fritz, J.J., Thermodynamics and Statistical Mechanics, John Wiley and Sons, Inc., New York, 1959.
- https://flexbooks.ck12.org/cbook/ck-12-chemistry-flexbook-2.0/section/18.4/primary/ lesson/ potential-energy-diagrams-chem/
- https:// www.expii.com/t/ energy-diagram- overview-parts-8727
- https://chemistryvce.weebly.com/energy-profile-diagrams.html