
Fluorescence spectrophotometry is a set of techniques for measuring the fluorescence produced by substances when subjected to ultraviolet, visible, or other electromagnetic radiation. When a sample is illuminated with a xenon flash lamp, a fluorescence spectrophotometer—also known as a fluorometer, fluorospectrometer, or fluorescence spectrometer—measures the fluorescent light emitted from the sample at various wavelengths. It is widely utilized in chemical and biological sciences because it may assess a biological system by monitoring its interactions with fluorescent probe molecules.
In the literature, the words fluorescence spectroscopy, fluorometry, and spectrofluorometry are frequently used interchangeably.
What is a Fluorescence Spectrophotometer?
A fluorescence spectrophotometer, often known as fluorimetry or spectrofluorometry, is a sophisticated branch of electromagnetic spectroscopy that analyzes the fluorescence generated by a specimen. This approach uses a specialized laser beam, primarily in the UV range, to activate the electrons in certain chemical compounds. When these electrons are excited, they emit light, which is usually visible, but not always.
- This method is distinct from the absorption spectrophotometer, which studies the light absorption properties of molecules. However, in the context of a single-molecule fluorescence spectrophotometer, the approach goes deeper, catching intensity changes in emitted light from individual fluorophores or pairs.
- The operational mechanism of the fluorescence spectrophotometer is to drive a light beam with wavelengths spanning from 180 to 800 nm into a cuvette holding the solution of interest. The sample’s radiated light is then measured at a certain angle.
- With this method, it is possible to record the sample’s emission spectrum (light emitted) as well as its excitation spectrum (light absorbed). The cuvette route length, solvent concentration, excitation wavelength, and intrinsic characteristics of the sample all have an impact on the emission intensity, which is directly correlated with the analyte’s concentration.
Principle of Fluorescence Spectrophotometer
A fluorescence spectrophotometer is a scientific method used to investigate molecular and atomic interactions by examining the fluorescence emitted from a sample. This technique operates on the basic principle of radiative emission, which occurs when a molecule absorbs energy at a particular wavelength, displaying a transition dipole moment.
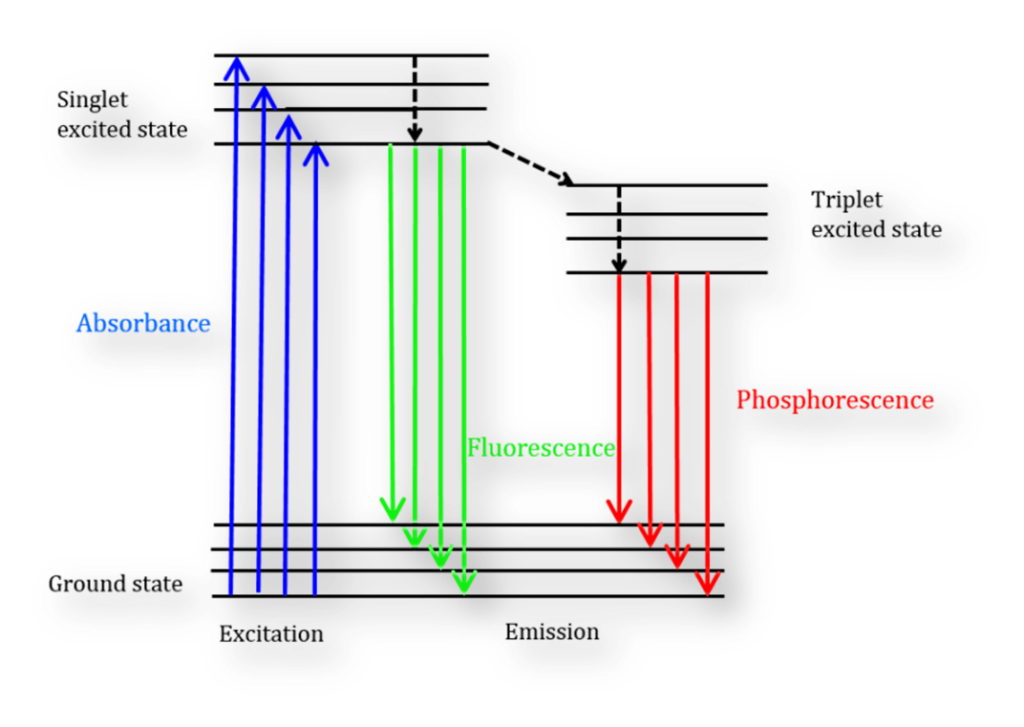
Figure: Jablonski Diagram
When the molecule absorbs this energy, its photons move to an excited singlet state. These photons subsequently undergo a relaxation process, returning to the lowest vibrational energy level of the excited state. During this transition back to the molecule’s ground state, photons are emitted, resulting in the production of fluorescence.
Fluorescent molecules exhibit three primary nonradiative relaxation mechanisms, where the excitation energy does not transform into photons: internal conversion, external conversion, and intersystem crossing.
- Internal conversion occurs when there’s a minimal energy gap between two electronic states, causing electrons to shift from a higher to a lower energy state, with the energy being absorbed by the vibrational modes of the electronic state.
- External conversion leads to energy loss as the fluorophore interacts with surrounding solute molecules.
- Intersystem crossing occurs when the energy levels of the excited singlet and triplet state overlap, prompting electrons to transition between these states.
Photon emission resulting from electrons returning to their ground state from the triplet state is termed phosphorescence. Notably, phosphorescence peaks appear at longer wavelengths compared to fluorescence peaks because of the triplet state’s lower energy. Due to the forbidden nature of these transitions, phosphorescence has a more prolonged duration than fluorescence.
Understanding the electronic and vibrational states of molecules is possible with the use of a fluorescence spectrophotometer. The species being studied usually possesses both an excited and a ground electrical state. The species absorbs a photon during fluorescence, changing from its ground state to one of the vibrational modes of the excited electronic state. The structure of the vibrational levels is revealed in detail by this transition and the photon emissions that follow. Resonance fluorescence, in which the wavelength of the emitted and absorbed photons are frequently the same, is seen in atomic species.
Emission and excitation measurements are the two categories into which fluorescence measurements fall in practice.
- The detection wavelength varies in emission measurements, whereas the excitation wavelength stays constant.
- In contrast, the excitation wavelength is changed and the detection wavelength remains constant during excitation measurements.
- Emission spectra from different excitation wavelengths are compiled to create an emission map, a three-dimensional data representation that provides a thorough understanding of emission intensity as a function of both excitation and emission wavelengths.
Fluorescence Phenomenon
- Fluorescence is a phenomenon that results from the complex energy levels that are present in all molecules. A molecule’s electron is raised from its ground state (S0), which is its initial state, to one of the several possible excited singlet states (S1, S2, and so on) when it takes in a photon.
- Molecules that are prone to these transitions typically have complex atomic arrangements. These structures may involve atoms with unpaired electron sets, like oxygen (O) and nitrogen (N), or they may feature aromatic and aliphatic conjugated unsaturated systems that enable widespread electron delocalization.
- The electron then moves to S1, the lowest vibrational level of the main excited state, after this excitation. This decrease is accompanied by an energy-releasing mechanism known as “internal conversion.”
- After that, the excited state is further relaxed to its lowest vibrational level. After exiting the S1 state, which lasts for about 10^9 seconds, the molecule can take several different routes back to its ground state (S0). These paths include:
- Fluorescence: Fluorescence is a radiative process in which photons are released as a result of energy loss during internal conversion. Interestingly, the energy of these released photons is lower than that of the original ones that were absorbed.
- Non-radiative process: These comprise several mechanisms, such as
- Internal Conversion: This process entails solute or solvent molecules colliding with one another or relaxing through internal vibrations.
- Energy Transfer: In this case, energy is transmitted to another chemical substance, causing a photochemical reaction or generating an excimer, which is an excited-state dimer, or an exciplex, which is an excited-state complex. The photons emitted by these structures have longer wavelengths than fluorescence.
- Intersystem Crossover: This mechanism converts the molecule to a triplet state called T1, which lasts far longer than its S1 predecessor (typically more than 10-5 seconds). After that, this state can either relax by internal conversion processes or release energy by a delayed process called phosphorescence.
Fluorescence Spectrophotometer Process
- Fluorescence spectrophotometry relies on the phenomenon of fluorescence, wherein light is emitted following the absorption of light—a process known as photoluminescence (photo meaning light and luminescence denoting the emission of light).
- Essentially, it involves the emission of light triggered by the absorption of light. Excitation refers to exposure to and absorption of light in this context.
- When there is a substantial delay between the excitation and light emission, this kind of photoluminescence happens. A long delay here means about 10-6 seconds or longer. When the delay between excitation and emission is shorter (between 10-6 and 10-8 seconds), the result is fluorescence.
- Since phosphorescence can last for a very long time after being exposed to light, you might be able to see the glow-in-the-dark star on the ceiling of your bedroom hours after it has been completely dark outside. Conversely, fluorescence emits light in a brief burst (usually lasting 10 ns, though it can occasionally last less than 1 ns). Because of this, fluorescence is now detected and measured using complex electronics and optics.
- Fluorophores can exist in a variety of electronic and vibrational states, which are involved in the physics of fluorescence. Multiple vibrational states make up an electrical state.
- An electronic transition from the lowest vibration in the ground state to one of the vibrational levels in a higher electronic excited state can be triggered by photons with energy in the ultraviolet to blue-green range of the spectrum.
- The fluorophore molecule relaxes into the lowest vibrational level of the excited electronic state as soon as the photon’s energy input, or excitation, ceases.
- The fluorophore stays in this condition for the fluorescence lifetime, which is approximately 10 nanoseconds, before going back to the electronic ground state. The energy released during this return to the ground state is referred to as fluorescence emission.
- The quantum yield is the ratio of photons absorbed by a fluorophore to photons released by the fluorophore.
- Every time, the excitation radiation has a higher energy, shorter wavelength, and emits lower energy radiation. For instance, the appropriate fluorophore will emit green light (longer wavelength) if the incoming light is blue (shorter wavelength).
Components of Fluorescence Spectrophotometer
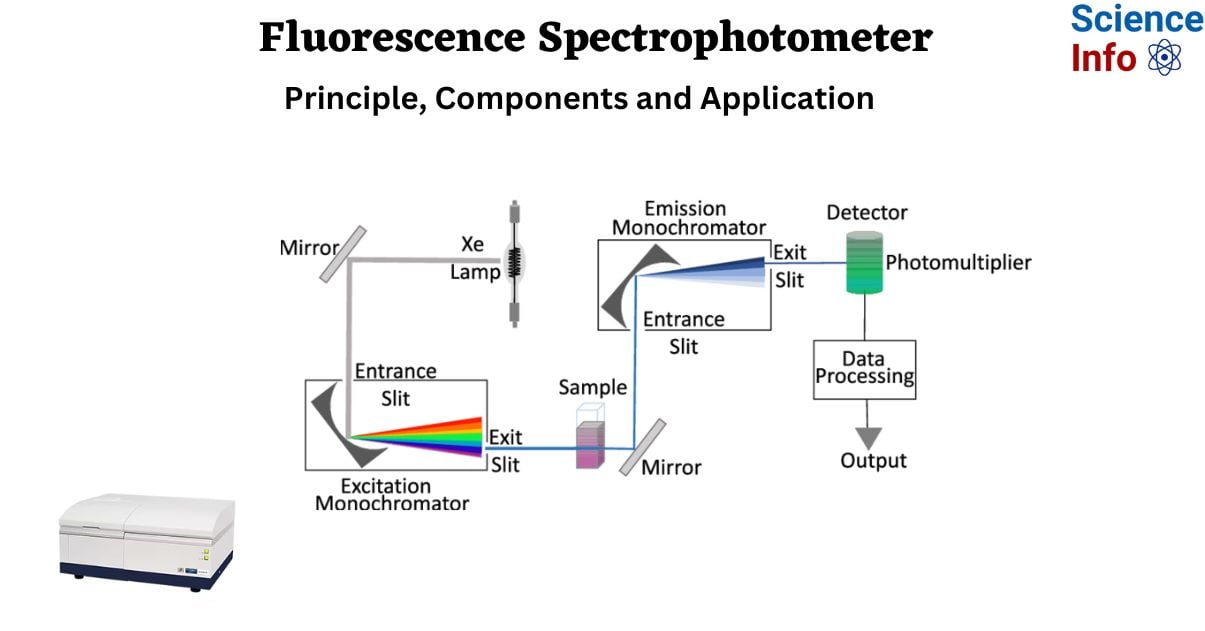
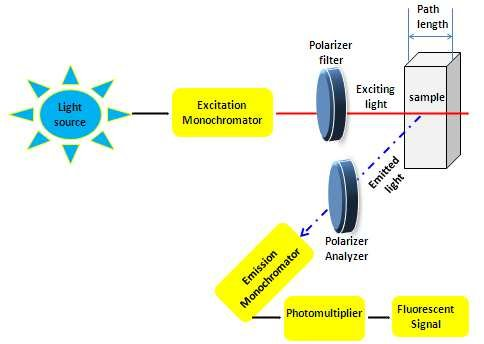
Fluorescence spectroscopy is carried out using a well-defined operating technique that includes several important components to ensure accurate measurement. The apparatus used for this purpose comprises several important components, including a light source, two monochromators, a sample holder, and a detector. The following stages explain the normal operational protocol:
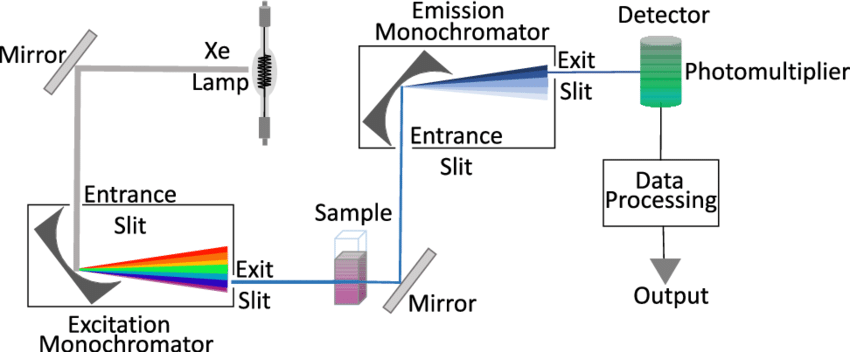
- Light Source: The instrument is fitted with a light source that can emit radiation in the ultraviolet, visible, and near-infrared wavelengths. This source serves as the sample’s excitation beam.
- Monochromator: The setup features two monochromators. The first monochromator is in charge of determining the appropriate wavelength for excitation, whilst the second monochromator is used for accurate analysis of produced light.
- Detector Orientation: The detector, usually a photomultiplier tube, is positioned at a right angle to the excitation beam. This orientation enables the efficient capture of fluorescence generated by the sample in all directions.
- Excitation of Sample: The sample to be studied is placed in a sample chamber, which is often a cuvette with translucent quartz or glass sides. When the sample is exposed to excitation light, the molecules in the solution become excited and emit fluorescence.
- Excitation Monochromator: The excitation light from the lamp source is routed through an optical system to the excitation monochromator. This monochromator allows for accurate selection or scanning of a specified wavelength range for excitation.
- Fluorescence Emission: The selected excitation wavelength is subsequently directed into the sample compartment, which houses the fluorescent cuvette. When the excitation light interacts with the sample, it excites the molecules within it, and some of them emit light in response.
- Emission Monochromator: The emission monochromator examines the fluorescence that is emitted in all directions. This monochromator is perpendicular to the entering excitation beam and is responsible for wavelength analysis.
- Wavelength Analysis: The emission monochromator allows for the measurement of fluorescence intensity at a specific wavelength, which is critical for acquiring spectral information about the material.
- Detector and Measurement: The analyzer monochromator directs the selected wavelength of emitted light to the detector, which is commonly a photomultiplier tube. The photomultiplier tube detects the intensity of emitted light and converts it to an electrical current.
- Display: The photomultiplier tube’s output current is delivered to a measurement instrument, which displays the fluorescence level. This gadget offers a quantitative measure of fluorescence intensity, enabling sample characterization and analysis.
Application of Fluorescence Spectrophotometer
Fluorescence spectrophotometer has nearly limitless applications. It is difficult to think about the chemical and biological sciences without this approach today. Only a few examples of application per sector, for some of the most popular sectors it is employed in, will be discussed in the brief review below.
- Bioscience: One of the most common applications of fluorescence spectrophotometers in biosciences is high-precision DNA and RNA measurement. An extrinsic fluorophore (usually ethidium bromide) is added to a DNA sample, which is then fed into a fluorescence spectrometer to determine its concentration. Another current application is single molecule real-time (SMRT) DNA sequencing. Its ability to manufacture long-read single molecules with great precision is projected to be essential to the next genetic diagnostic revolution.
- Biochemistry and Molecular Biology: A fluorescence spectrophotometer is critical for understanding the structure, function, and interactions of biomolecules such as proteins, nucleic acids, and lipids.
- Pharmaceutics: Spectrofluorometric techniques are often employed in pharmaceutical research to analyze medications. An example is the examination of co-formulated pills given for cholesterol treatment. Atoreza©, a tablet containing Ezetimibe and Atorvastatin calcium, may be easily and accurately analyzed using synchronous fluorescence spectroscopy. The procedure is appropriate for routine quality checking of the drug.
- Industry: A fluorescence spectrophotometer is utilized in a variety of industrial contexts to analyze pollution quickly and non-invasively (Kohli, 2012). For instance, it has been used to detect contaminating organic chemicals in groundwater following hydraulic fracturing for gas exploration.
- Environmental: This technique is also widely used in environmental monitoring. One example is the treatment of water near garbage sites.
- Agricultural: In agriculture, spectroscopic techniques are commonly used to identify distinct crop kinds. The laser-induced fluorescence emission technique (LIFS) is a good tool for identifying citrus seedling varieties. Tea producers employ total luminescence spectroscopy as an objective and economical way to differentiate between comparable types of tea.
- Nanoparticle study: Fluorescence spectrophotometer is an important tool for characterizing nanoparticles used in medication administration. It aids research into interactions between nanoparticles and biomolecules, particularly the protein corona generated when nanoparticles interact with biological fluids.
Advantages of Fluorescence Spectrophotometer
- High sensitivity
- Non-destructive
- Multiplexing
- Specificity
- Versatility
- Cost-effective
- Low background noise
Disadvantages of Fluorescence Spectrophotometer
- Quenching
- Hight cost reagents
- Limited dynamic range
- Limited to certain molecular species
- Interference from other sources
- Photobleaching
References
- Albani, J., 2007. Principles and applications of fluorescence spectrophotometer. Oxford; Ames, Iowa: Blackwell Science.
- Ayad, M.F. and Magdy, N., 2015. Application of new spectrofluorometric techniques for determination of atorvastatin and ezetimibe in the combined tablet dosage form. Chemical and Pharmaceutical Bulletin, 63(6), pp.443-449.
- Jacobkhed, 2002. Jablonski diagram of absorbance, non-radiative decay, and fluorescence.
- So, P.T. and Dong, C.Y., 2001. Fluorescence spectrophotometry. e LS.
- https://microbiologynote.com/fluorescence-spectrophotometry-definition-principle-parts-advantages-uses/
- https://conductscience.com/fluorescence-spectrophotometry-principles-and-applications/
Nice article in simple form. ????