Mass spectroscopy of Elements helps for determining the atomic mass of atoms or molecules. It can be used to determine a compound’s relative isotopic abundance, atomic and molecular mass, and structure.
A Mass Spectrometry result is a graph that plots mass per charge against relative abundance. The ability to distinguish between objects (atoms or groups of atoms) with various masses is possible by the production of isotopes by distinct atomic masses and the fragmentation of molecules into smaller groups of atoms. This data helps to calculate the relative isotopic abundance, atomic or molecular mass, or structure of a molecule.
The Base Peak is the peak with the greatest abundance (largest size), whereas the Molecular Ion is the peak with the highest mass.
Mass Spectroscopy and Isotopes
Many elements exist as isotope mixtures. The atomic masses of isotopes differ.
Isotopes are atoms that have the same number of protons but differing numbers of neutrons.
The fraction of atoms with a certain atomic mass found in a naturally occurring sample of an element is known as its relative abundance.
When the relative abundances of an element’s isotopes are multiplied by their atomic masses and the results are added up, the result is the element’s average atomic mass, which is a weighted average.
Mass spectrometry helps to determine the relative quantity of each isotope. The relative quantity of each isotope can be determined by analyzing an element in a TOF mass spectrometer.
A mass spectrometer uses a high-energy electron beam to ionize atoms and molecules, then deflects the ions through a magnetic field based on their mass-to-charge ratios (m/z). A sample’s mass spectrum displays the relative abundances of the ions on the y-axis as well as their m/z ratios on the x-axis. If z equals 1 for all ions, then the x-axis is expressed in atomic mass units.
Relative Abundance of Element
The y-axis of a mass spectrum reflects relative abundance (relative intensity). It compares the amount of an ion produced to the amount of the most abundant ion (the base peak).
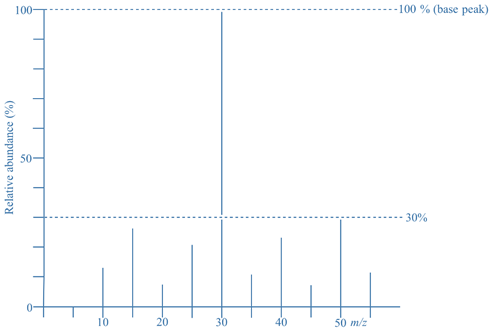
- In the given mass spectrum, the ion of m/z = 30 has relative abundance of 100%, so it is the base peak.
- The ion of m/z = 50 has a relative abundance of 30%, meaning the mass spectrum contains 30% as many ions of m/z =50 as m/z = 30 (the base peak).
- Although it does not mean 100% of the ions produced have m/z = 30 and another 30% have m/z = 50. This is not possible because 100% + 30% = 130%, and it’s not possible to produce more than 100%.
Mass Spectrum
A mass spectrometer also helps to calculate atomic masses, but it can also be used for;
Quantitative analysis, which calculates the concentration of minute amounts of substance using a calibration curve for a unique signal with a known m/z value.
Qualitative analysis, in which the mass spectrum of a compound produced by a mass spectrometer is unique and provides a fingerprint of the specific substance that can be identified from a mass spectrum database. The spectrum can also reveal the structure of an unknown chemical.
A mass spectrum is a histogram plot of intensity vs. mass-to-charge ratio (m/z) of a chemical sample, which is typically obtained using a mass spectrometer.
Some mass spectrometers split analyte molecules into fragments, whereas others observe whole molecular masses with negligible fragmentation. Depending on the type of mass spectrometer and the experiment, a mass spectrum can reflect a wide range of information.
Steps to Identify Elements and Mass Using Mass Spectrum
Step 1: Determine the main isotope by locating the longest spectral line (largest value via y-axis).
2: Determine the mass of the main isotope by reading the value on the x-axis.
3: Using the periodic table, calculate the mass of the main isotope in relation to the average atomic mass.
4: Confirm your choice by researching the isotope abundance of the chosen element.
Calculating an Element’s Isotopic Abundance
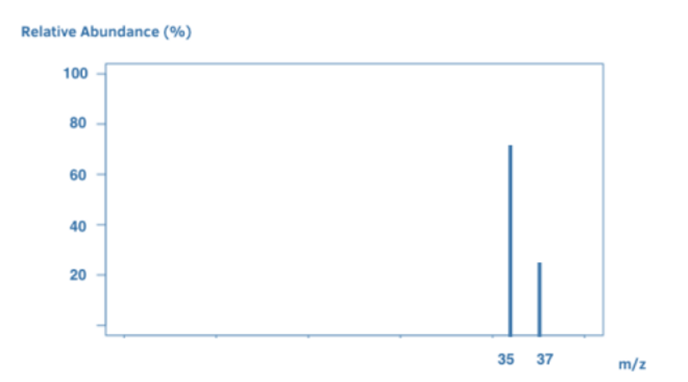
The number of peaks indicates the amount of isotopes. Each line (peak) in a mass spectrum represents a particle of a particular mass. Because isotopes have distinct weights, if you investigate an element (for example, a sample of chlorine), each peak will represent a different isotope of chlorine. For example, the two isotopes Cl-35 and Cl-37 may have peaks at 35 and 37.
Some elements only have a single stable isotope. Some elements have only one isotope. As a result, there should only be one peak at the element’s relative atomic mass.
The relative isotopic abundance is given by the height of each peak.
The greater the peak, the more abundant that particular isotope is in comparison to the other isotopes.
Calculate Relative Atomic Mass of an Element (using % abundance)
The mass spectrum allows one to calculate the relative atomic mass. To calculate total mass:
- Multiply the relative isotopic abundance (%) on the y-axis by the m/z on the x-axis for each isotope.
- Divide the total masses of each isotope by 100.
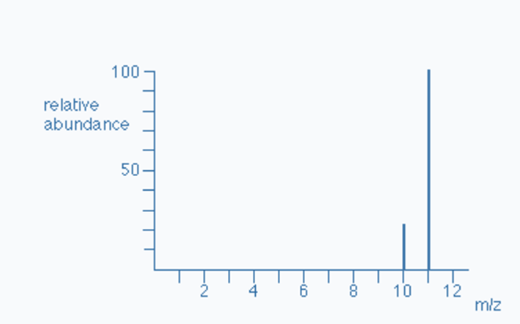
For Example: To Determine the Relative Atomic Mass of Boron
- To calculate total mass, multiply the relative isotopic abundance (%) on the y-axis by the m/z on the x-axis for each isotope.
The mass spectrum of boron is depicted in above graph. We can notice two peaks, indicating that boron has two isotopes. One isotope has a mass of ten, whereas another has a mass of eleven.
Boron-10 appears to have a relative abundance of 22%. Boron-11 appears to have a relative abundance of 78%.
Hence; Boron-10 = 22% and Boron-11 = 78%.
The total mass of all Boron-10 atoms = (22 x 10) = 220.
Total mass of all Boron-11 atoms = (78 x 11) = 858.
- Total the masses of each isotope and divide by 100.
The total mass of all Boron-10 atoms + The total mass of all Boron-11 atoms = (220 + 858) = 1078
Hence, 1078/1100 = 10.78
Mass Spectroscopy of Elements
During the mass spectrometry process, the sample is struck with high-energy electrons, which break apart the molecule. The mass spectrum differs slightly in issues like these. The peak with the highest m/z ratio is the parent peak and it gives us the sample’s relative molecular mass. Each element has a unique mass spectrum. Mass spectra help in the identification of elements. We know it’s chlorine when we detect a mass spectrum with peaks at 35 and 37.
Monoatomic Elements
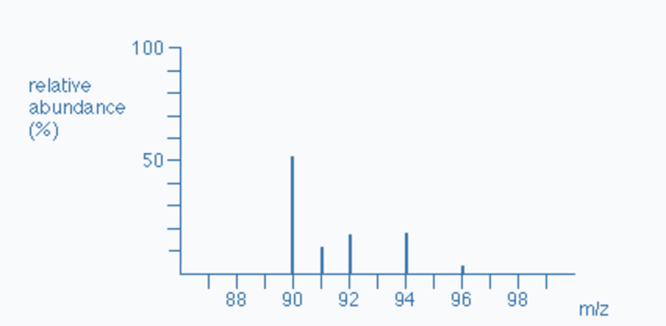
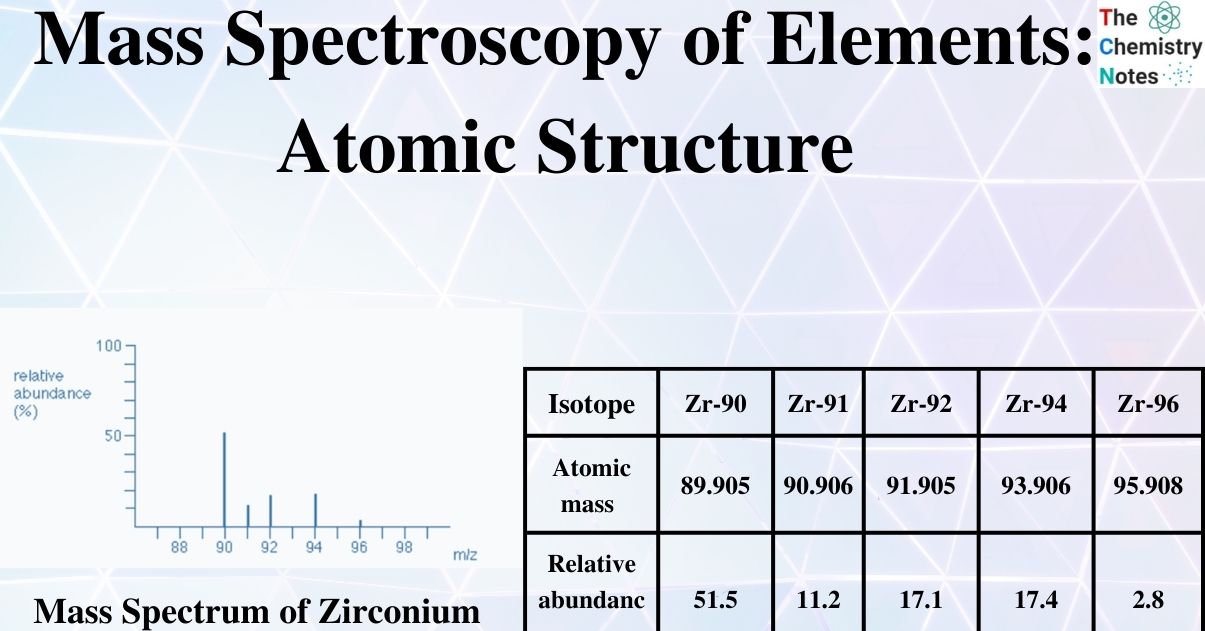
The total number of isotopes: The five peaks in the mass spectrum indicate that there are five isotopes of zirconium, with relative isotopic masses on the 12C scale of 90, 91, 92, 94, and 96.
The relative abundances are now provided as percentages. Again, these relative abundances can be determined by measuring the lines on the diagram.
The five isotopes in this instance are in order of their proportional % abundances):
| Isotope | Zr-90 | Zr-91 | Zr-92 | Zr-94 | Zr-96 |
|---|---|---|---|---|---|
| Atomic mass | 89.905 | 90.906 | 91.905 | 93.906 | 95.908 |
| Relative abundance | 51.5 | 11.2 | 17.1 | 17.4 | 2.8 |
Diatomic Elements
Some elements have two atoms. Chlorine (Cl2) has two Cl atoms. Cl2 ions are ionized in the mass spectrometer to generate molecular ions. Because the ions are highly unstable, they frequently split up to form Cl ions.
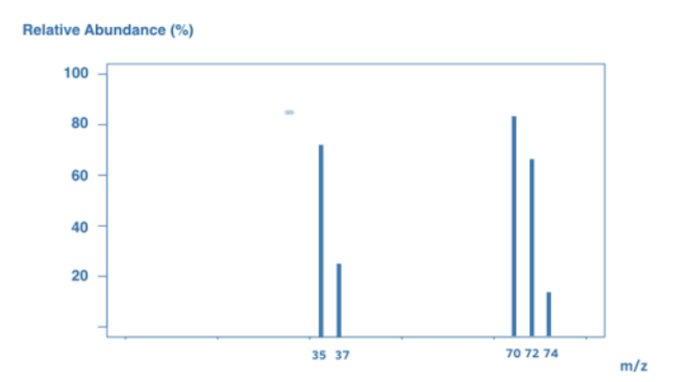
As a result, the mass spectrum contains a combination of Cl2 molecules and Cl atoms. However, keep in mind that Cl contains two isotopes: Cl-35 and Cl-37. This results in a wide range of peaks:
A peak at 70 signifies a Cl2 molecular ion, which comprises two Cl-35 atoms.
A peak at 72 = Cl2 molecular ion, which comprises Cl-35 and Cl-37.
The peak at 74 signifies a Cl2 molecular ion, and this comprises two Cl-37 atoms.
Ion Cl-35 shows its peak at 35.
A peak at 37 represents a Cl-37 ion.
References
- https://studymind.co.uk/notes/mass-spectrometry-2/
- Theodore Lawrence Brown, Eugene, H., Bursten, B. E., Murphy, C. J., Woodward, P. M., Stoltzfus, M. W., & Lufaso, M. W. (2018). Chemistry : the central science (14th ed.). Pearson.
- https://secure-media.collegeboard.org/digitalServices/pdf/ap/ap-chemistry-course-and-exam-description
- https://chem.libretexts.org/Bookshelves/Analytical_Chemistry/Supplemental_Modules_(Analytical_Chemistry)/Instrumental_Analysis/Mass_Spectrometry/The_Mass_Spectra_of_Elements
- https://study.com/skill/learn/identifying-elements-and-masses-using-a-mass-spectrum-of-an-element-explanation.html